Contents
Overview
Analysis: Gather Data and Modelling
Stripping Out The Election Premium
Modelling The Historic Election Premium
What Are The Trades?
Long The Election Premium: Trade The Trump Odds Divergence
Short The Election Premium: Remain Vega Neutral With A Calendar Strangle
The Final Word
Summary
The report analyses the "election premium" in Bitcoin's implied volatility for the November 2024 U.S. presidential election. It employs a simplified methodology to quantify this premium, providing context for its significance in cryptocurrency trading and potential impact on options strategies.
The analysis reveals an 8% election premium in Bitcoin's implied volatility. Historical data shows a recent cheapening trend in this premium, which demonstrates a loose positive correlation with prediction market odds of a Trump election victory, though some divergence has been observed in recent weeks.
Two trading strategies are proposed to capitalise on the election premium: a straightforward long OTM call play to go long the election premium, and a more complex vega-neutral calendar strangle to go short.
Figure 1 : Why is the BTC volatility curve kinked?
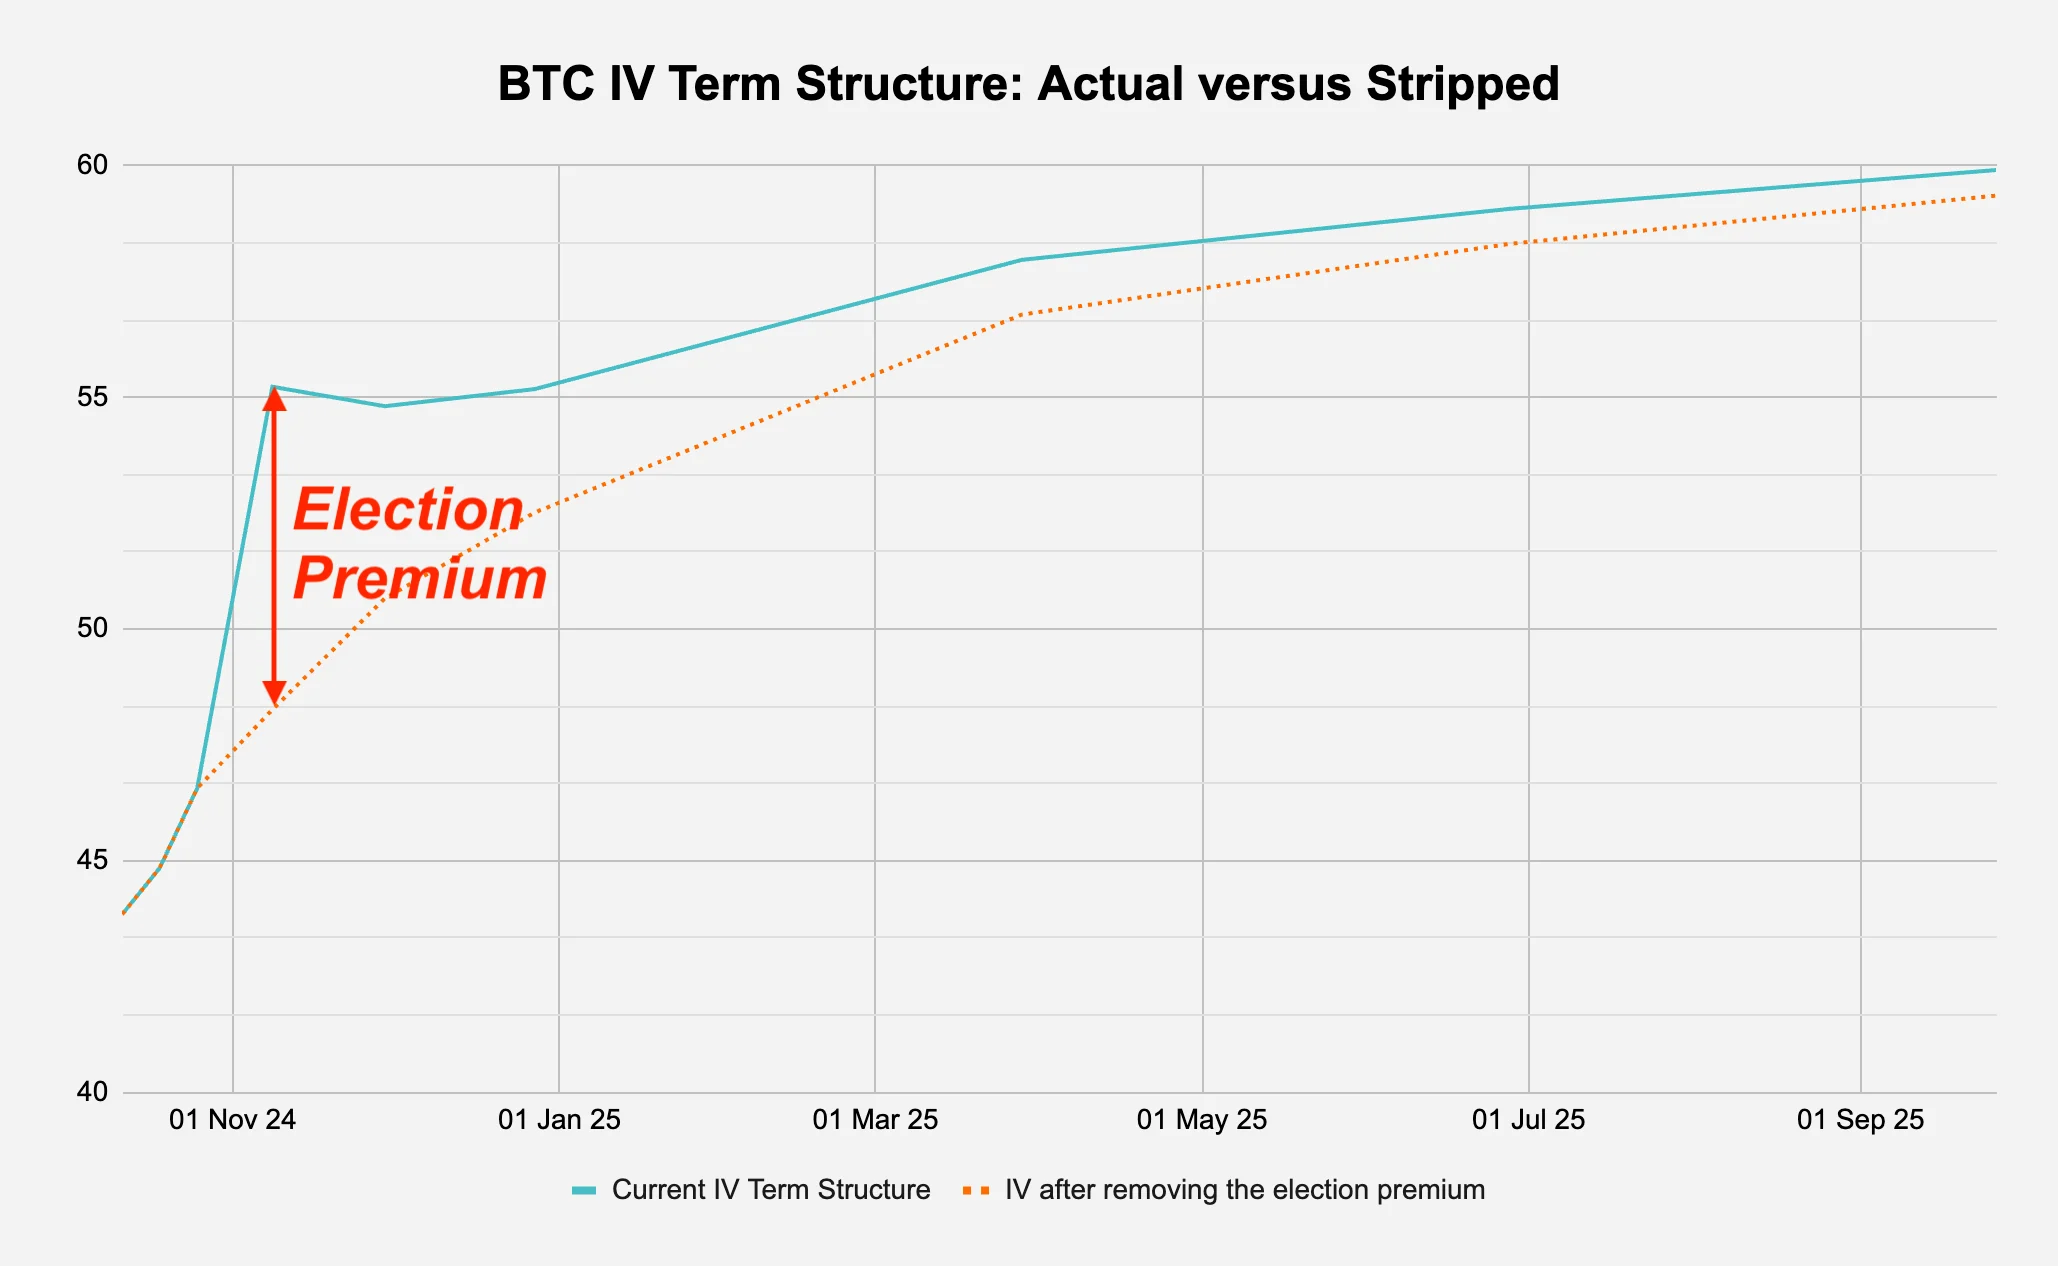
Source: Deribit via Laevitas, Presto Research; (data as of 05Oct24)
1. Overview
The U.S. presidential election in November 2024 presents a unique opportunity in the Bitcoin options market. As political events increasingly influence cryptocurrency markets, understanding and quantifying the "election premium" embedded in Bitcoin's implied volatility (IV) becomes crucial for sophisticated traders and investors.
This report delves into the nuances of the Bitcoin election premium, offering a step-by-step guide for a simplified yet insightful methodology to strip out event premiums from implied volatility, as well as data-driven analysis of its current state, historical context, and potential trading implications. We find that BTC implied volatility pricing suggests that the market expects bitcoin to potentially move an extra 8% per day, on top of its normal daily volatility, due to election-related uncertainty.
The report concludes with two simplified trading strategies: a straightforward long election premium play and a more complex vega-neutral calendar strangle to short the election premium. These strategies serve as practical applications of our findings and a starting point for traders to develop their own approaches to capitalising on the election-driven volatility dynamics in the Bitcoin market.
For an introduction to the general crypto options market, readers are encouraged to read Presto Research’s crypto options primer, Crypto Derivatives Series II: Options (13Aug24).
2. Analysis: Gather Data and Modelling
Throughout this analysis, we focus on the first available options expiring after the election which is the 08Nov24 contract (election is on 05Nov24). All the data provided was taken on 05Oct24 and the majority of the research was written on the 06th. It is very important that the reader understand that the analysis provided in this research is very crude, and that the purpose here is to provide a basic framework for stripping out event premiums in volatility and translating that into a view, rather than presenting a tradeable idea backed by in-depth research. We are just smoothing out the current IV term structure (as of 05Oct24 writing), and not calculating the forward volatility.
One massive assumption that we will be making for simplicity is the single event impact one, where we will be attributing all the excess volatility to the election event. However, on 07Nov24 (two days after the election and 1 day before the 08Nov24 expiry options IV we will be analysing), there is an FOMC meeting where the Fed is expected to cut 25bps. There will be other assumptions and important factors that will be overlooked in this report.
Figure 2: There is a kink in the BTC IV term structure - this is the “election premium”
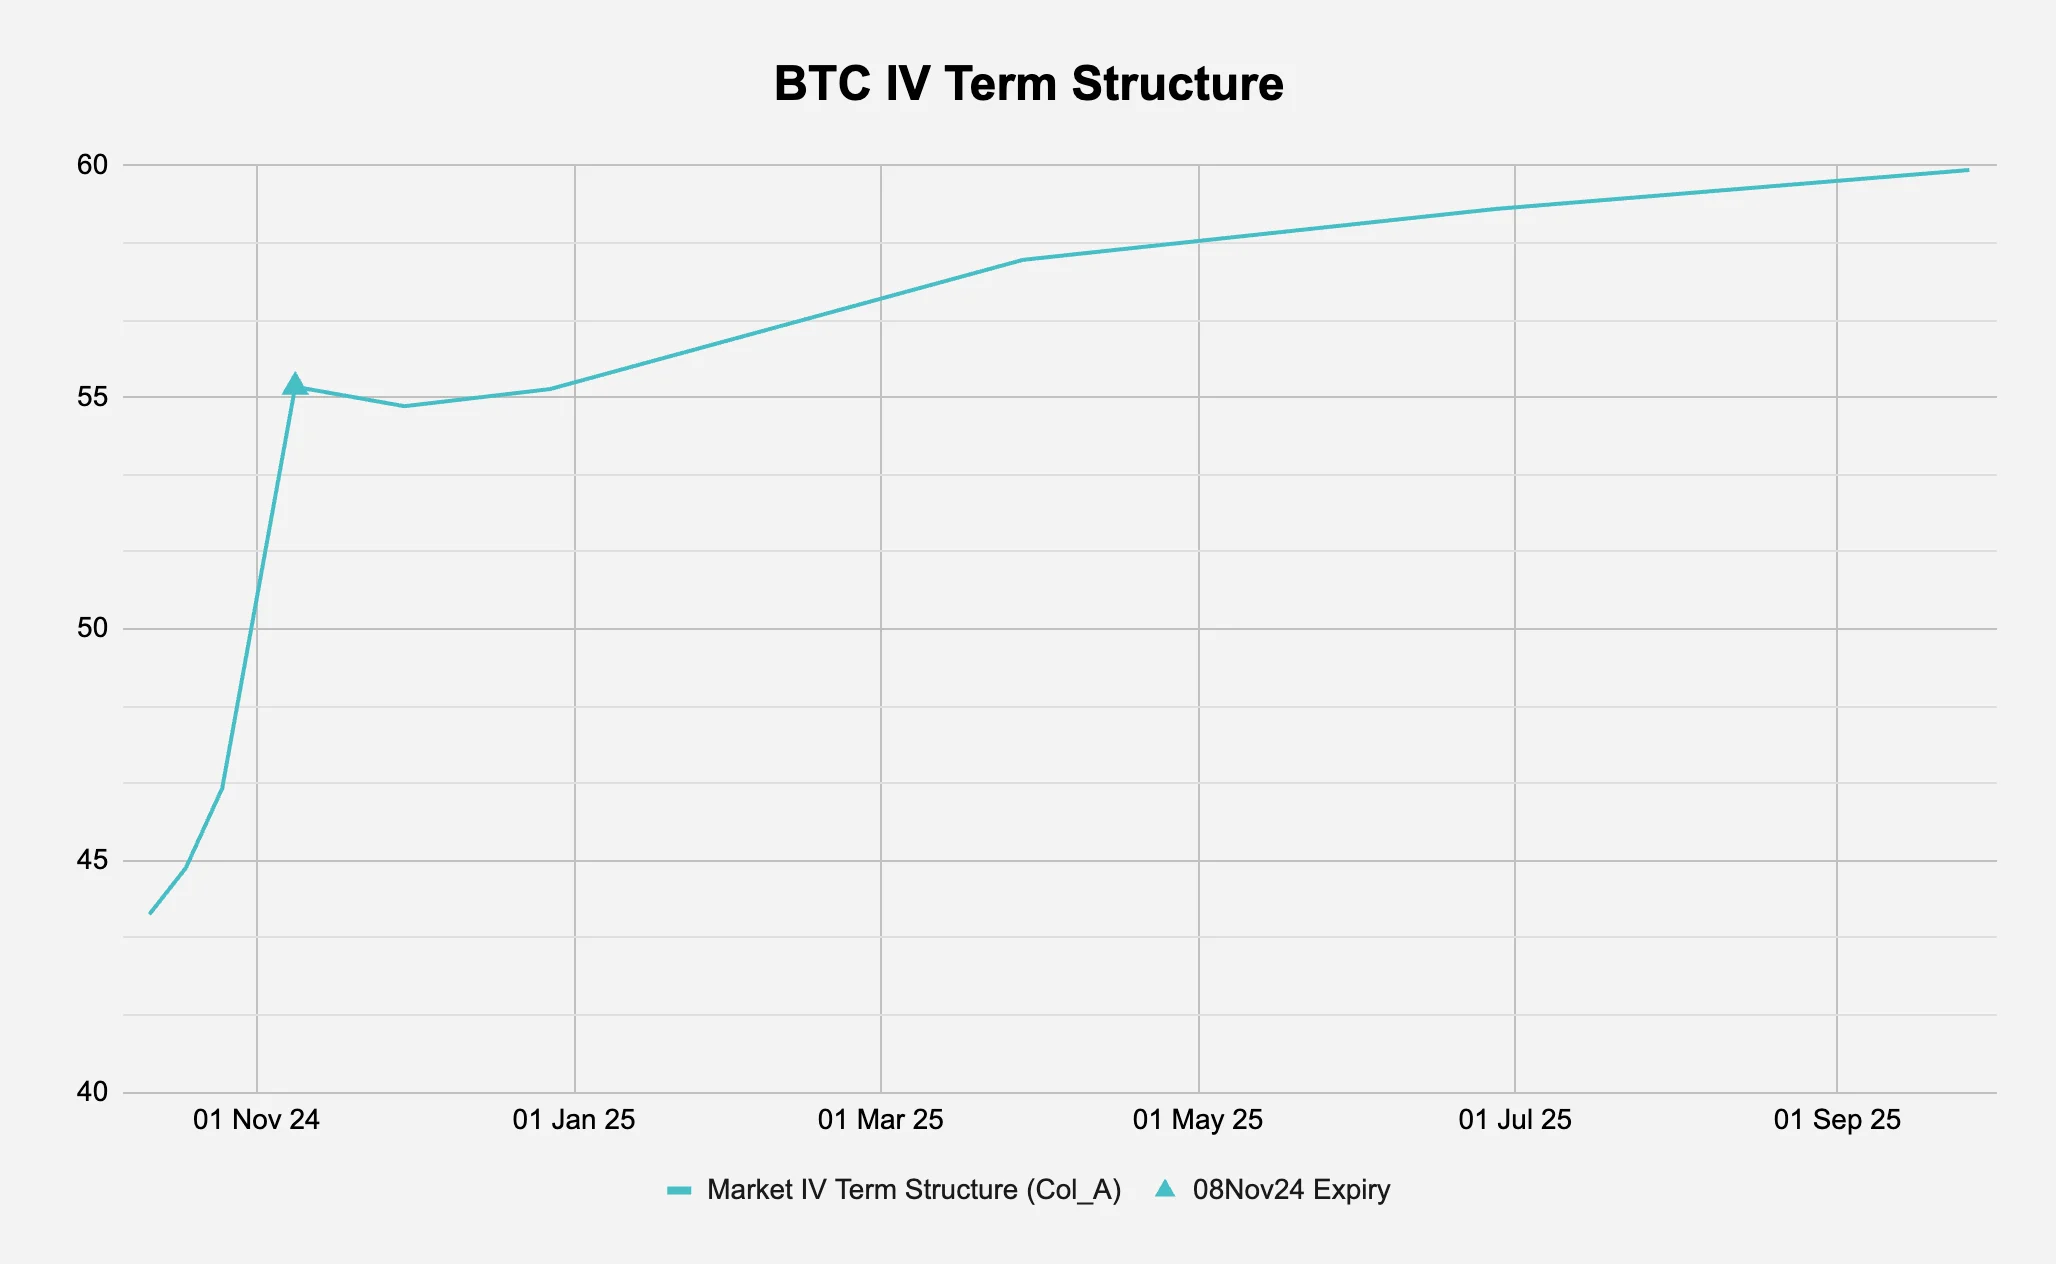
Source: Deribit via Laevitas, Presto Research; (data as of 05Oct24)
2.1 Stripping Out The Election Premium
To begin our analysis, we first take the current market BTC implied volatility term structure and attempt to “strip out” the election premium. As a reminder, the implied volatility (IV) term structure is the relationship between the implied volatilities of options on the same underlying asset across different expiration dates, and shows how the market's expectation of future volatility varies for different time horizons, typically visualised as a curve plotting implied volatility against time to expiration (see Figure 2 for the current BTC term structure).
As mentioned earlier, our process of stripping out the election premium involves some crude assumptions for simplicity and we are just smoothing out the current IV term structure and not calculating the forward volatility. This section outlines the steps to go from the market IV term structure to a “clean” term structure - visually speaking from Figure 2, “cleaning” means that we are trying to remove that election kink. We go through the process by referring to Figure 3a:
Figure 3a: Stripping away the IV election premium from the BTC term structure

Source: Deribit via Laevitas, Presto Research; (data as of 05Oct24)
Column A: Market IV
The IV is a measure of the market's expectation of future volatility for the underlying asset, derived from option prices. These are implied from Deribit’s option mark prices (via Laevitas).
For example, BTC options expiring 08Nov24 has an IV of 55.23, meaning that the market is pricing those options with an expectation that Bitcoin will have an annualised volatility of 55.23% between now and expiration.
Column B: Daily Move (%)
Col_B = Col_A / sqrt(365)
This represents the expected daily volatility of the underlying in percentage terms.
For example, the 08Nov24 options have an expected daily move of 2.89%. This means the market expects Bitcoin's price to move up or down by about 2.89% on average each day. This daily move is a one standard deviation move, which has about a 68% probability of occurring.
This is a simplified calculation that assumes volatility is constant and normally distributed.
Column C: # Days until Expiry
This is simply the number of days from today the option is set to expire.
Col_C = Expiration Date - today(05Oct24)
Column D: # Var Units
This represents the total variance expected over the remaining life of the option.
Col_D = Col_B^2 * Col_C
Breaking it down: Col_B^2 is the daily variance (volatility squared), and multiplying it by Col_C (the number of days until expiry) scales this daily variance to the full period until expiration.
Column E: Stripped Var Units
This is where we start working our way backwards. In this column, we strip away the event premium i.e. we attempt to model what extra daily move has been embedded in the current implied volatility.
Col_E = Col_D - ϵ^2
The formula is essentially removing a certain amount of daily variance (ϵ^2) from the total variance priced into the option (Col_D) i.e., trying to get the "normal" expected variance excluding the election effect. Since we are trying to isolate the effect of the election, we only apply this to the rows after the election, so all expiries until 25Oct24 (inclusive) remain unchanged (you can see that up until that row, Col_E = Col_D; Col_F = Col_B; Col_G = Col_A).
How do we know what ϵ to choose? There are many approaches but we keep it simple by trial-and-error, inputting our own guesses until we can draw Figure 2 without the election premium kink. This will make more sense when we get to Col_G.
Column F: Stripped Daily Move (%)
This is the daily volatility after stripping out the election premium, expressed as a percentage i.e., to get from Col_E ➔ Col_F, we simply do the reverse of Col_B ➔ Col_D.
More specifically, it's the square root of the average daily variance, excluding the event-specific (election) variance, giving us the standard deviation of daily returns, which is how we typically express volatility (like in Col_B).
Col_F = sqrt(Col_E / Col_C)
Column G: Stripped IV (8% E.P.)
We finally complete the process and get to the implied volatility after stripping out the election premium i.e., to get from Col_F ➔ Col_G, we simply do the reverse of Col_A ➔ Col_B.
This is our simple approximation of the "baseline" or "normal" implied volatility that the market expects, excluding the impact of the election event - a variation of the question we are trying to answer (slightly crudely) is “all else equal, what is the IV if there were no upcoming election?”
To continue from the explanation of Column E above, ϵ was some value of our choosing in percentage terms, which represented the daily volatility premium associated with the election. In Figure 3a, this is determined in the bottom input “Election Prem (%)” of “8.00”, i.e., 8%.
In Figure 3b below, when we plot Col_G against the original IV term structure, we can observe a pretty smooth looking curve (orange) versus the original curve with the election kink (turquoise). To further illustrate this process of “smoothing the curve”, Figure 3b also plots the IV with election premiums 1-percentage-point greater and less than what we have in our current model. As you can see, at 7% and 9% election premiums, we are either not “stripping out” enough event premium or we are stripping out too much respectively.
In layman’s terms, this is saying that the market is pricing in an additional 8-percentage-points of daily volatility due to the election event. This suggests the market expects bitcoin to potentially move an extra 8% per day, on top of its normal daily volatility, due to election-related uncertainty.
Figure 3b: We attempt to smooth the curve
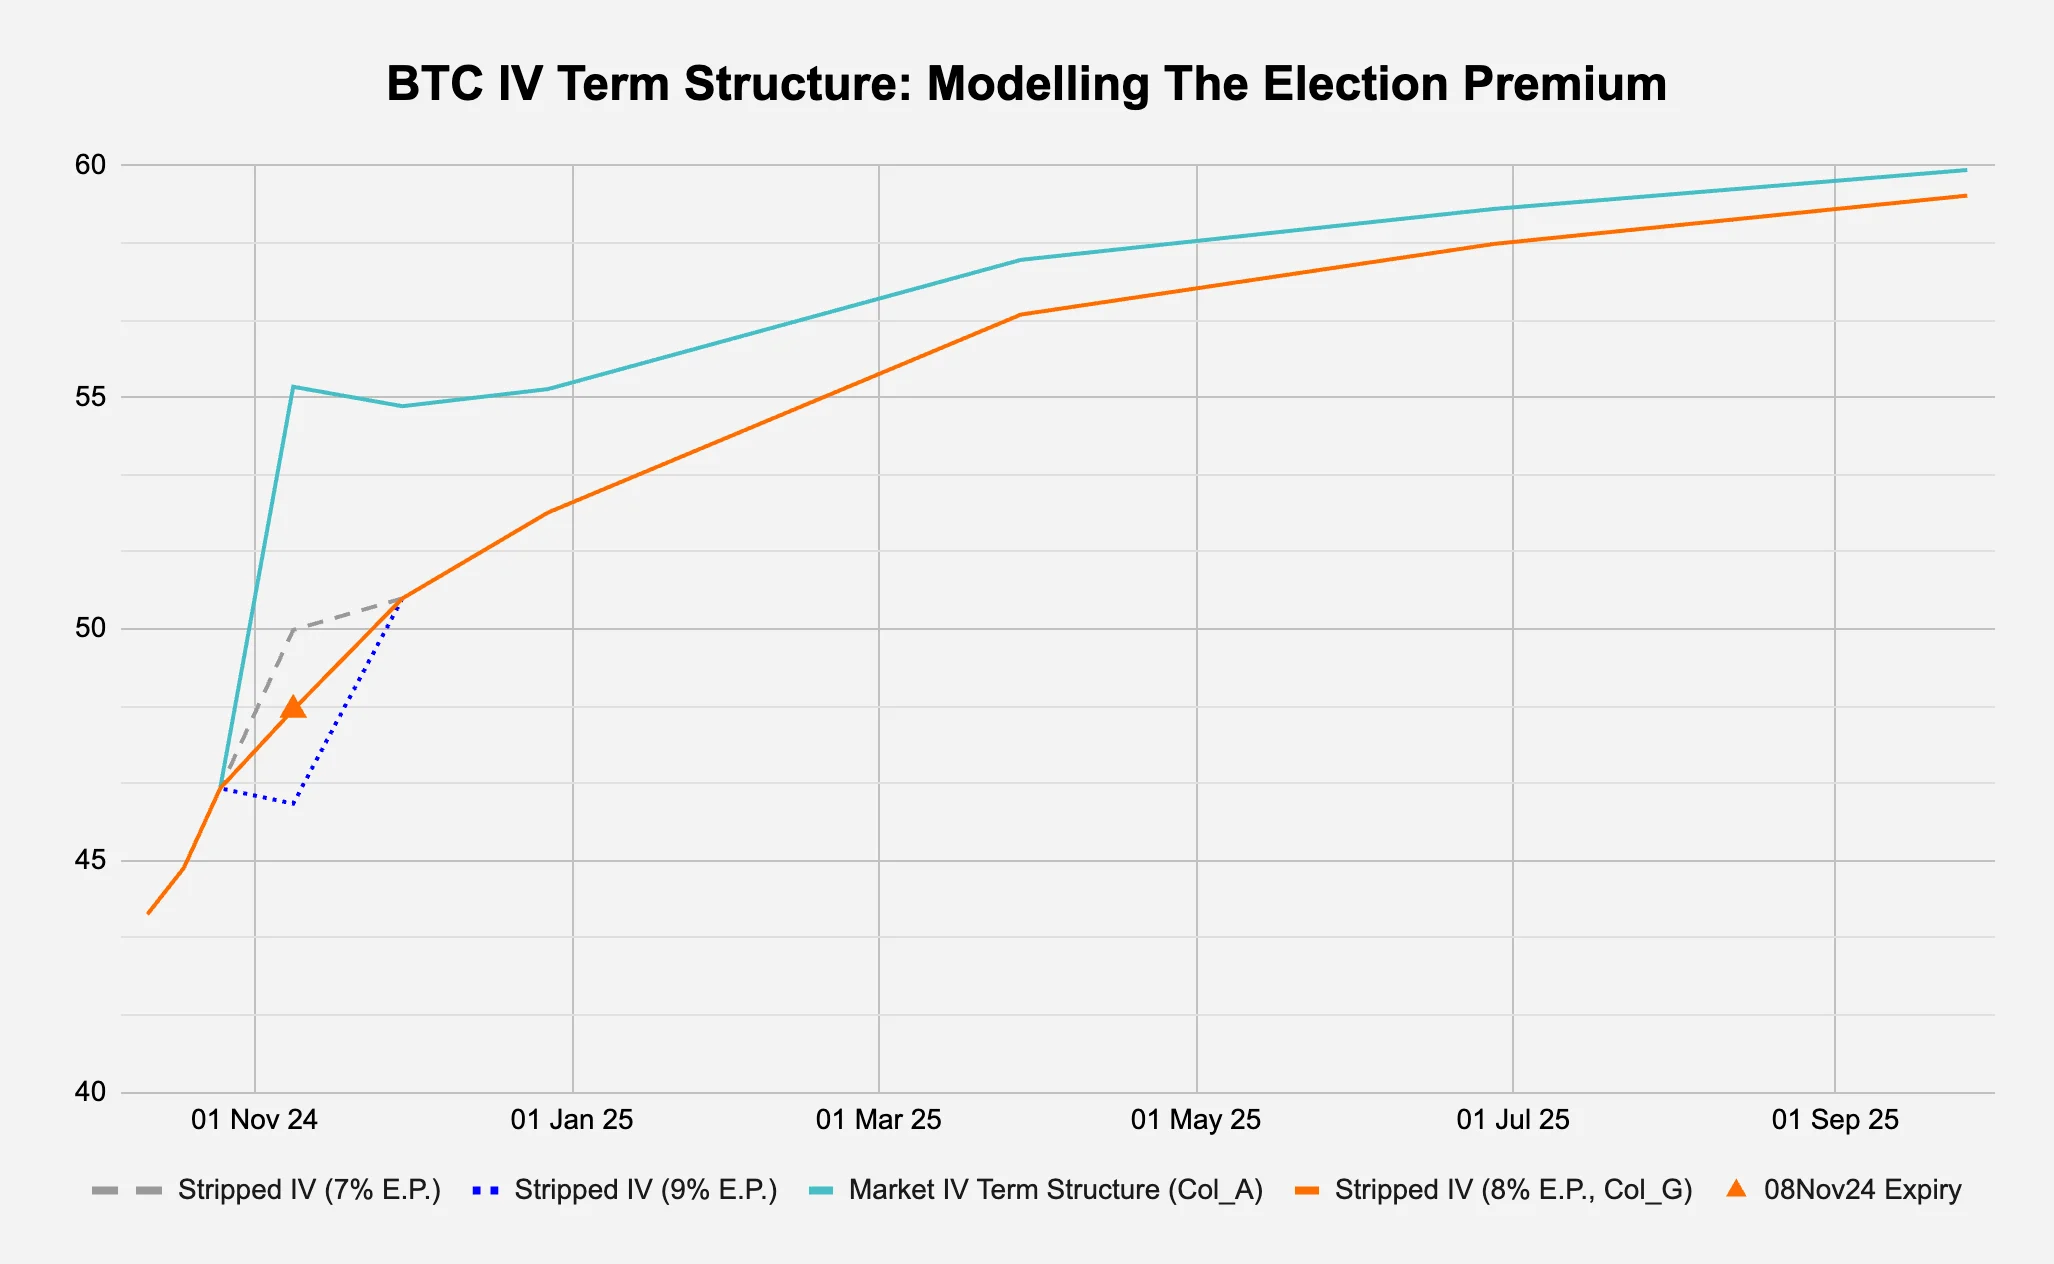
Source: Deribit via Laevitas, Presto Research; (data as of 05Oct24)
2.2 Modelling The Historic Election Premium
So we’ve established that the BTC options market is pricing in extra volatility of 8% due to the election. Is that too much? Is that too little? How can we put this into better context?
One way is to compare this to what traditional market options are implying. Figure 4 does the same election premium modelling as we did in §2.1 but on SPY and TLT, the most liquid ETFs on the S&P 500 and U.S. Treasury respectively.
Figure 4: Identifying the election premium for traditional markets
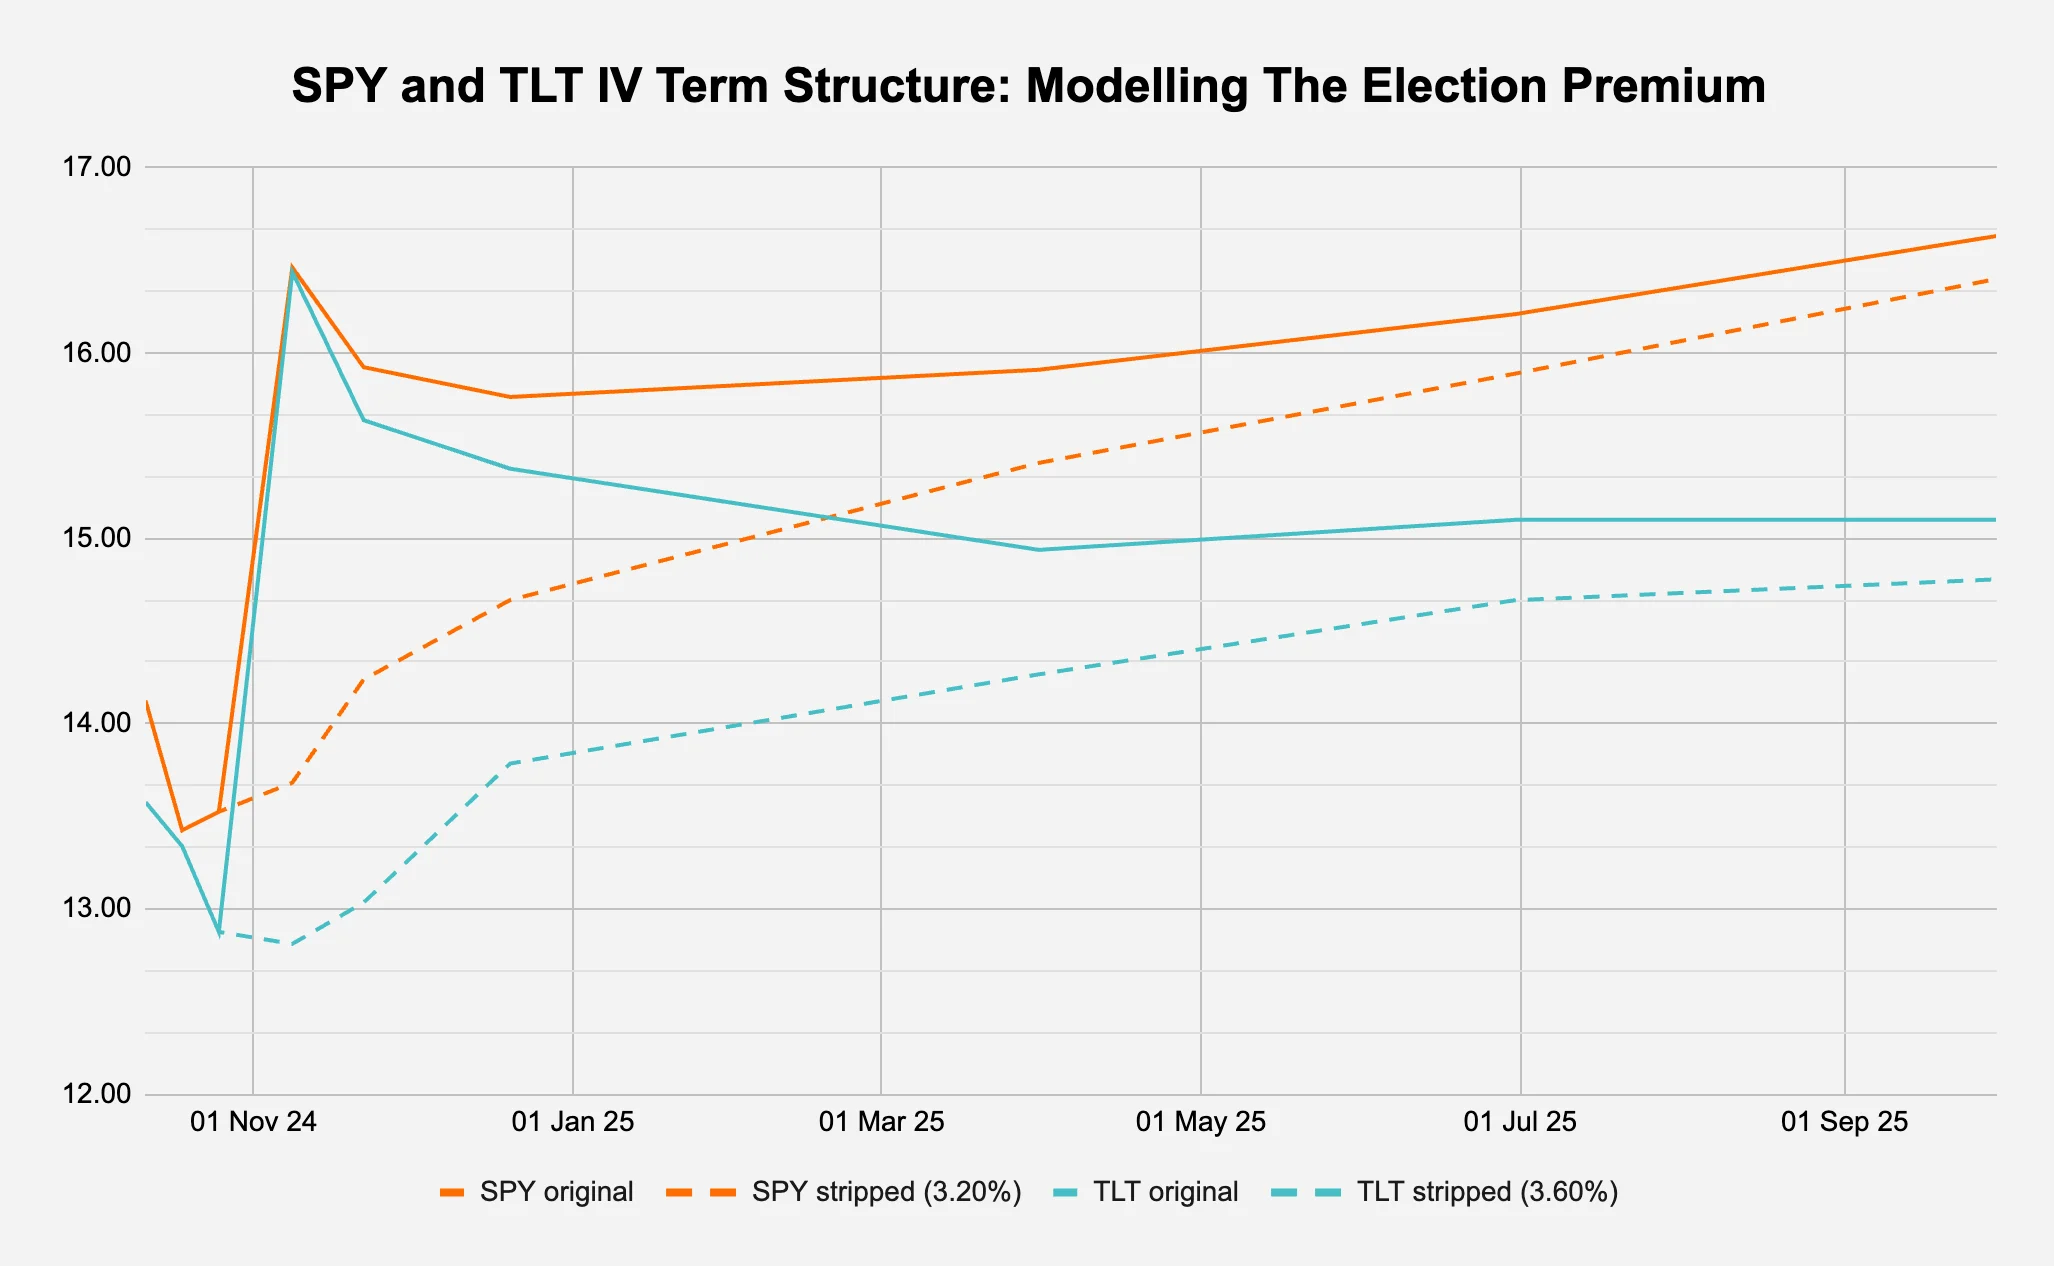
Source: CBOE via Interactive Brokers, Presto Research; (data as of 06Oct24)
Following the same process, we get to the rough election premium of 3.2% and 3.6% for SPY and TLT respectively, which is much smaller in magnitude than the 8.00% we determined for BTC. However, given that the stripped daily move is 85bps for SPY, 79bps for TLT, and 254bps for BTC, it should be expected that the additional daily volatility is lower for these traditional instruments.
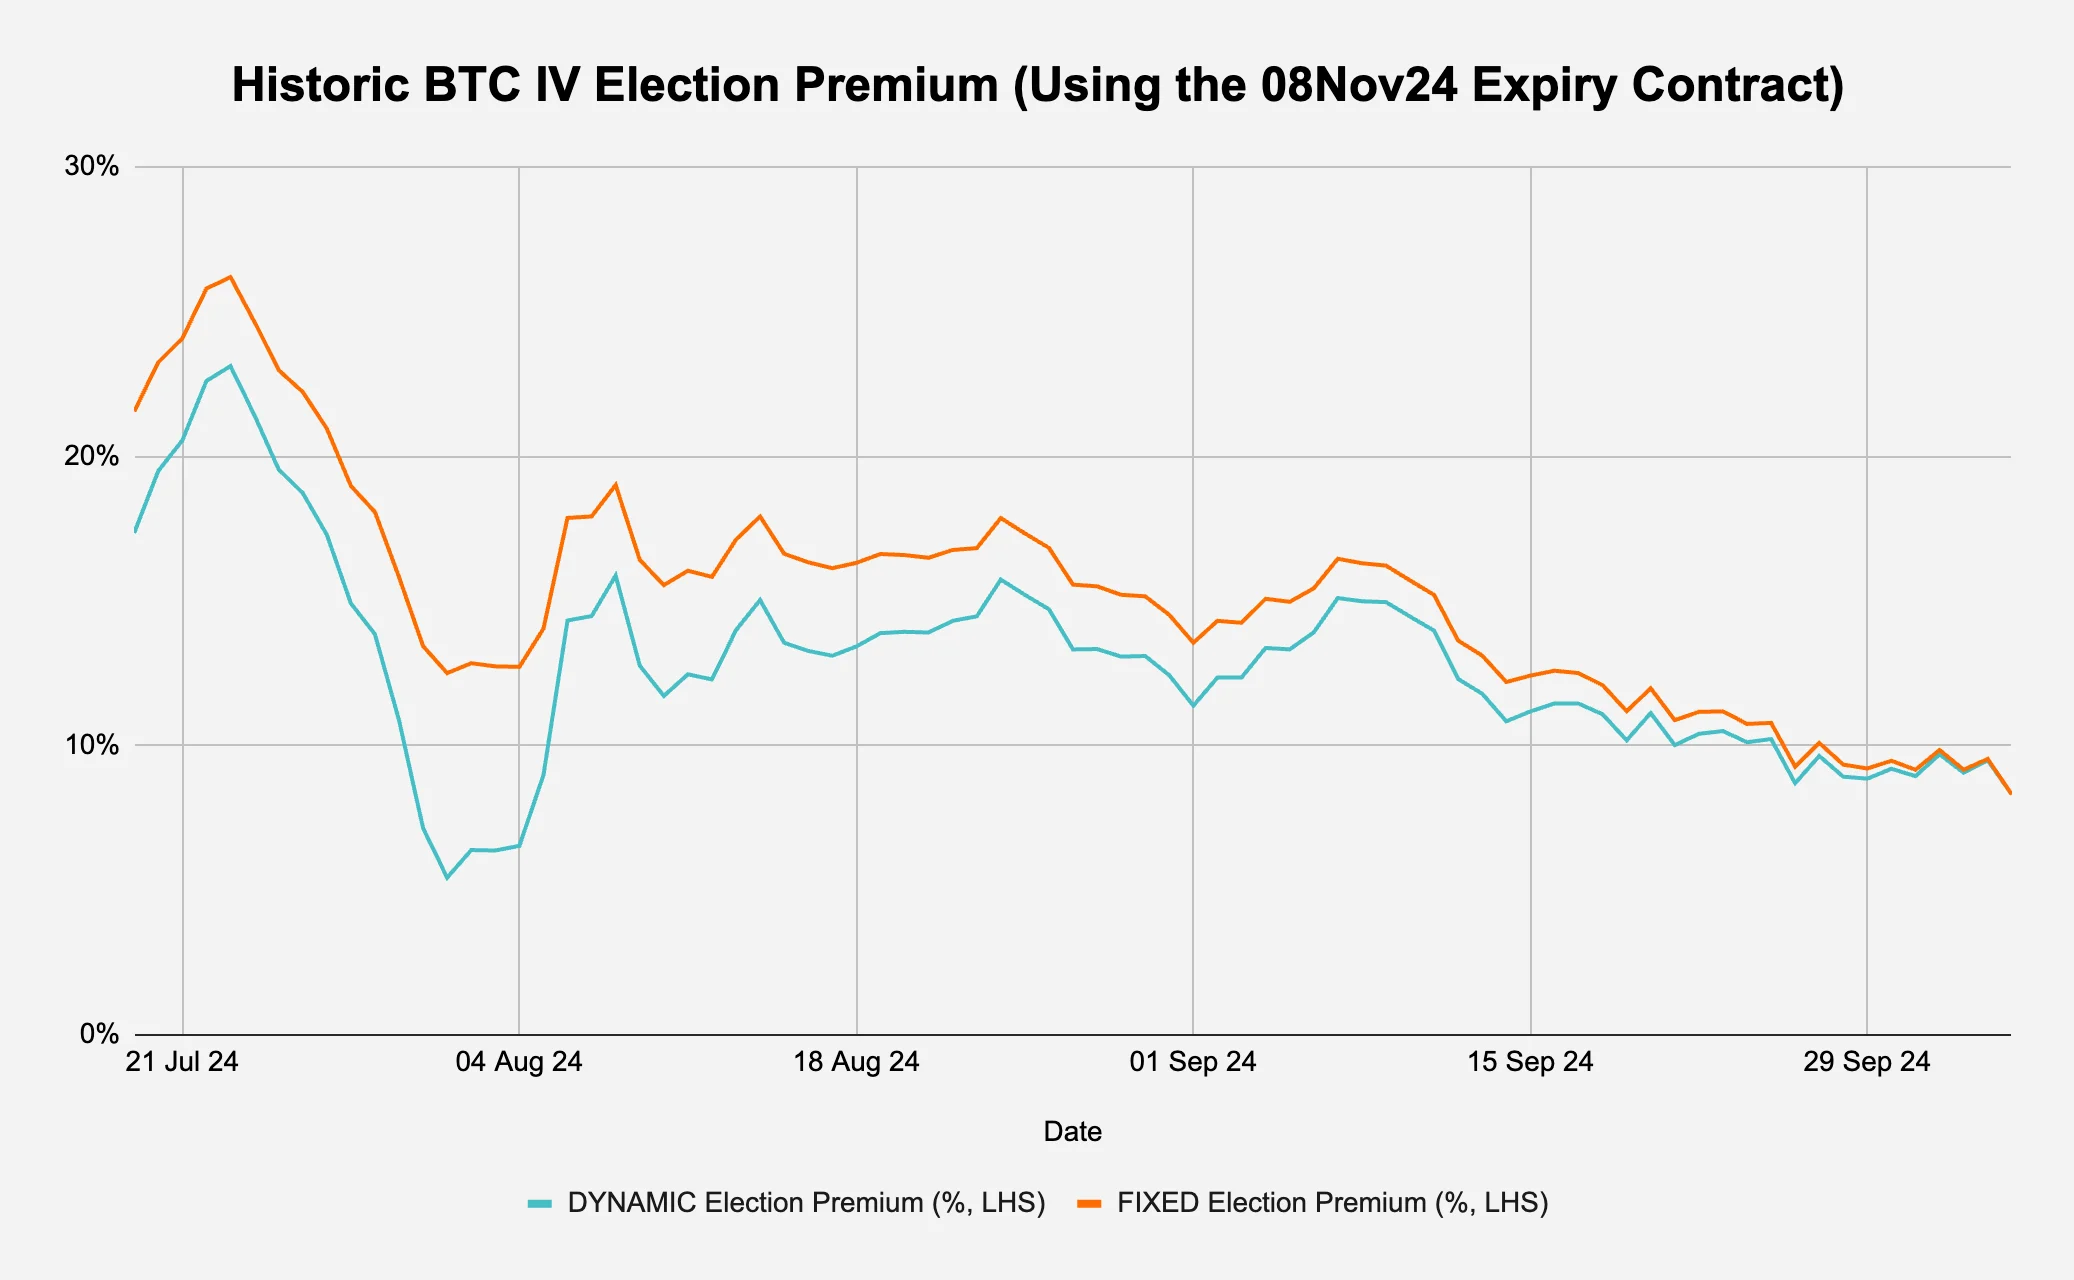
How about analysing BTC’s current election premium against its historic levels? Using the process outlined in §2.1, as long as we have a time series of the 08Nov24 expiring BTC IV, we can use the Stripped Daily Move (Col_ F) of 2.55 and work backwards to calculate the election premium over time. However, astute readers (or options traders) may notice an issue: given that the number of days until expiration is an input into the total variance expected over the remaining life of the option (Col_D), by using a fixed 2.55, we would essentially be assuming that the same total variance is spread over a different number of days as we move along the time series. This would lead to an overestimation of the event premium for past dates because we would spread 08Nov24-05Oct24 days worth of variance over a longer period. We therefore use the actual stripped daily move to calculate the dynamic election premium (Figure 5a):
Figure 5a: We dynamically calculate the total variance to plot the historic election premium
Source: Deribit via Laevitas, Presto Research; (data as of 05Oct24)
As predicted, we can immediately observe that using the fixed stripped daily move of 2.55 from the original analysis causes an overestimation of the election premium in all the days before 05Oct24. We can also see that there seems to be a general cheapening trend of the premium in the past few weeks.
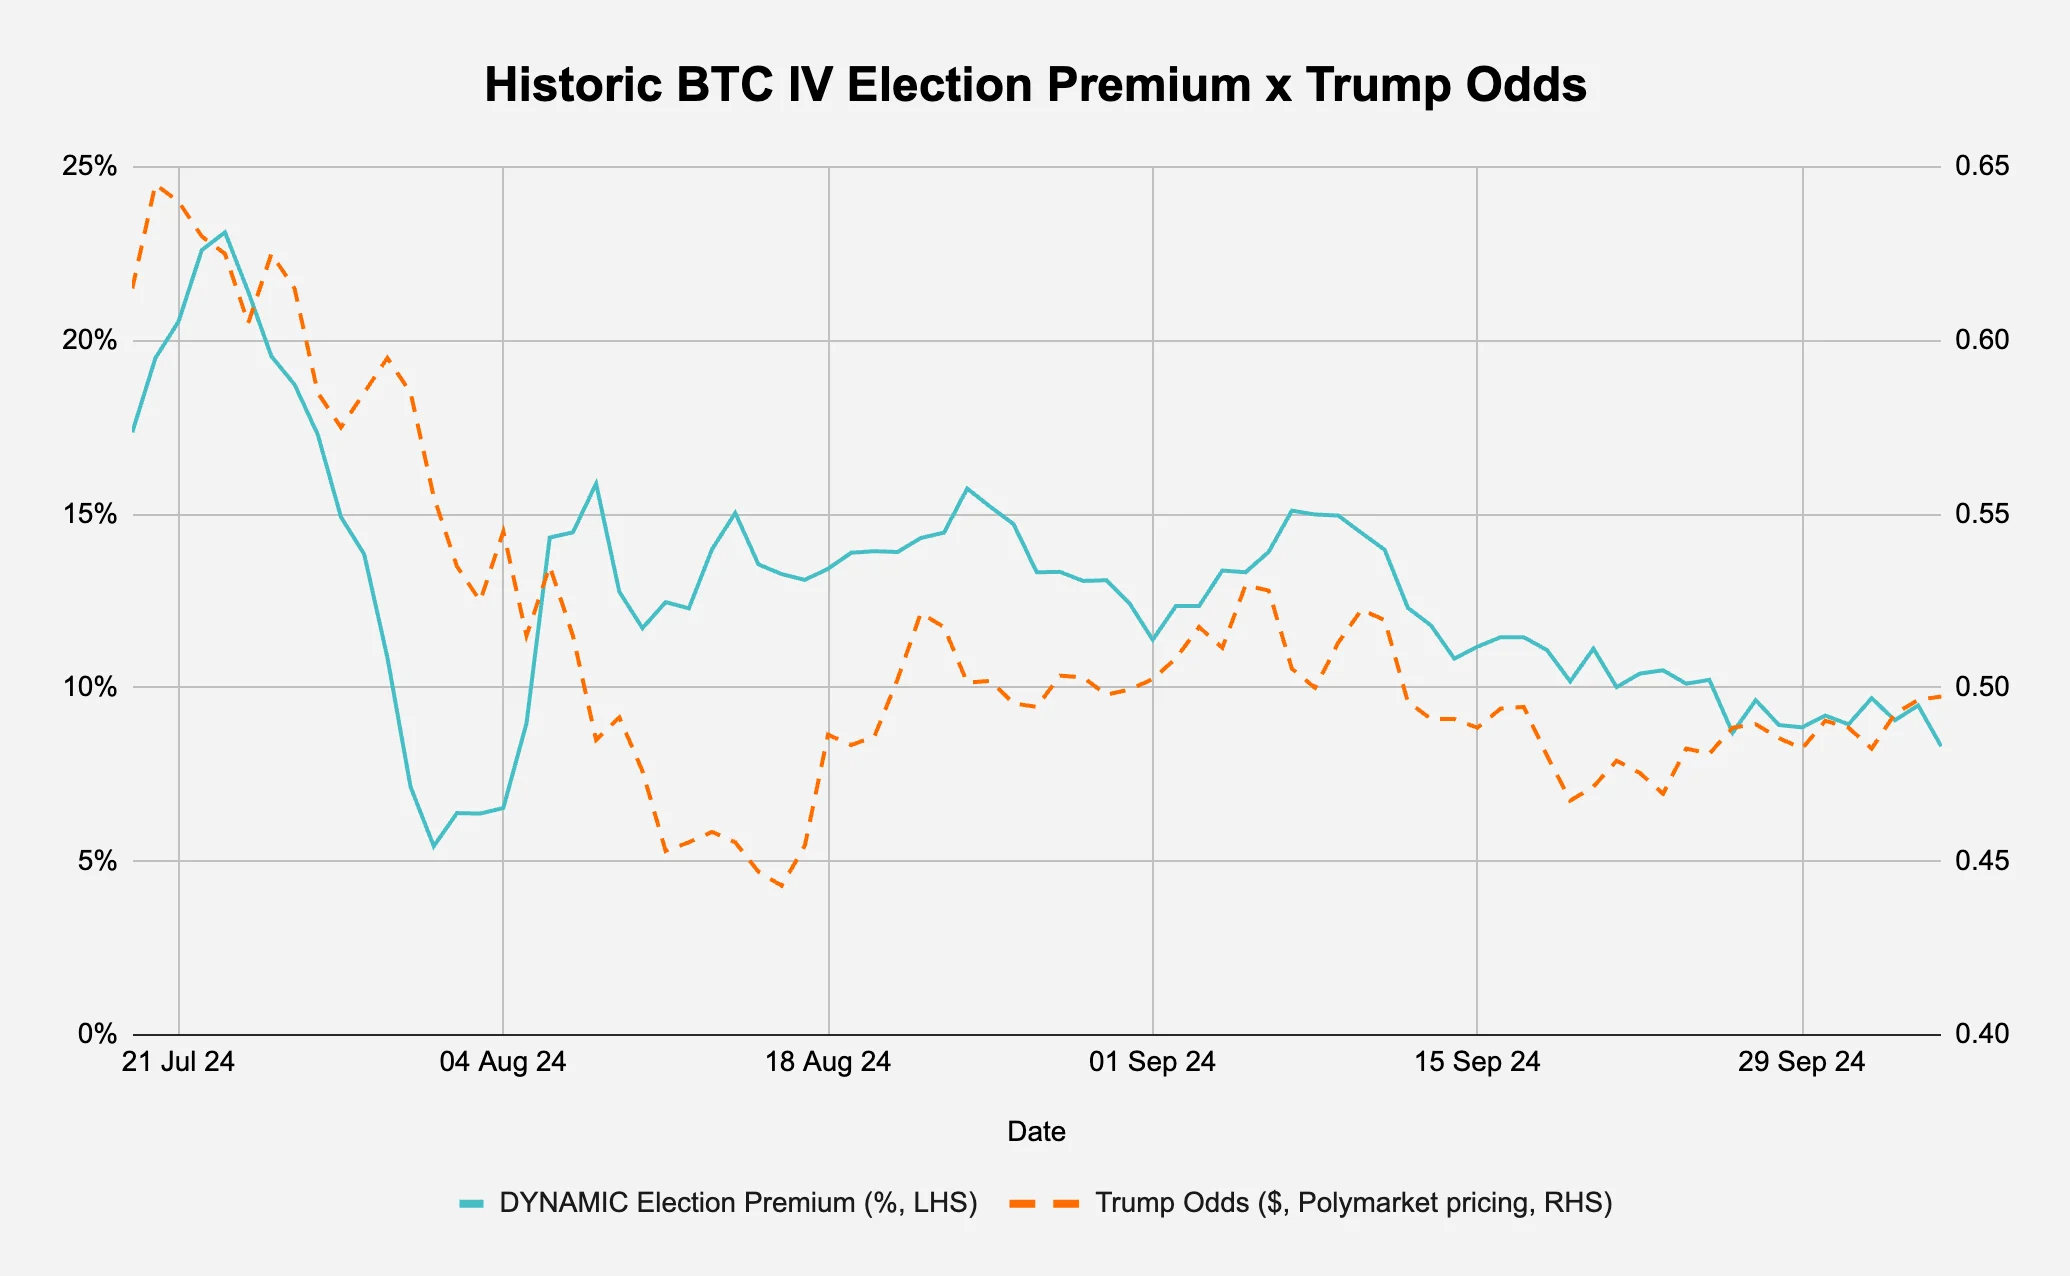
What are some of the factors that might influence this? One possibility is election related as the odds of pro-crypto Trump beating traditionally anti-crypto democrat leading Harris fluctuates. Figure 5b shows the dynamic election premium plotted against the prediction market’s odds of Trump winning the election.
Figure 5b: Is the election premium correlated to the expectation of Trump’s election odds?
Source: Deribit via Laevitas, Polymarket, Presto Research; (data as of 05Oct24)
As we can see, there seems to be some positive correlation (0.54) between the election premium and the market assigned odds of Trump winning. When we take a closer look at the past 2 weeks however, there is a slight divergence of this trend as the election premium has gone from 11% to 8% while the prediction market’s Trump win pricing has gone from 47c to 50c.
3. What Are The Trades?
As noted at the outset of §2, this research piece presents a deliberately basic analysis. This approach serves two purposes: it avoids overcomplicating the subject and provides educational material for new options traders, helping them begin to view the market through a volatility lens. Readers are encouraged to develop their own trades by conducting additional analysis and incorporating their personal market views. To demonstrate the practical application of these concepts, we present two examples - one simple and one more involved - of how trades can be structured based on the principles discussed thus far. We will avoid getting too detailed as specifics such as breakevens or the Greeks will change as the inputs like underlying price changes.
3.1 Long The Election Premium: Trade The Trump Odds Divergence
Given the divergence between the election premium and Trump odds, combined with the rising prediction market’s assigned odds for a Trump victory, as illustrated in Figure 5b, a simple trade is to go long an OTM call. By going long an 08Nov24 expiring call, you will implicitly be going long the election premium of 8% (i.e. long vol) and long the market for a Trump victory (the Greek exposures are: positive delta, positive gamma, positive vega, and negative vega).
This simple trade will be suitable if you think that:
The market pricing of an additional 8-percentage-points of daily volatility on top of its normal daily volatility due to the election event is too small;
The rising Trump odds is accurate;
A Trump victory will mean BTC will rally.
See Crypto Derivatives Series II: Options (13Aug24) for more on a simple long call position.
3.2 Short The Election Premium: Remain Vega Neutral With A Calendar Strangle
On the other hand, if you think that the additional 8-percentage-points of daily volatility due to election-related uncertainty is too much, you can also short this election premium.
One trade is to buy a calendar strangle, which involves two combined positions:
Sell a near-dated strangle (selling both a put and a call with the same expiration date and different strikes where strike_put < strike_call);
Buy a far-dated strangle (buying both a put and a call with a later expiration date and different strikes where strike_put < strike_call).
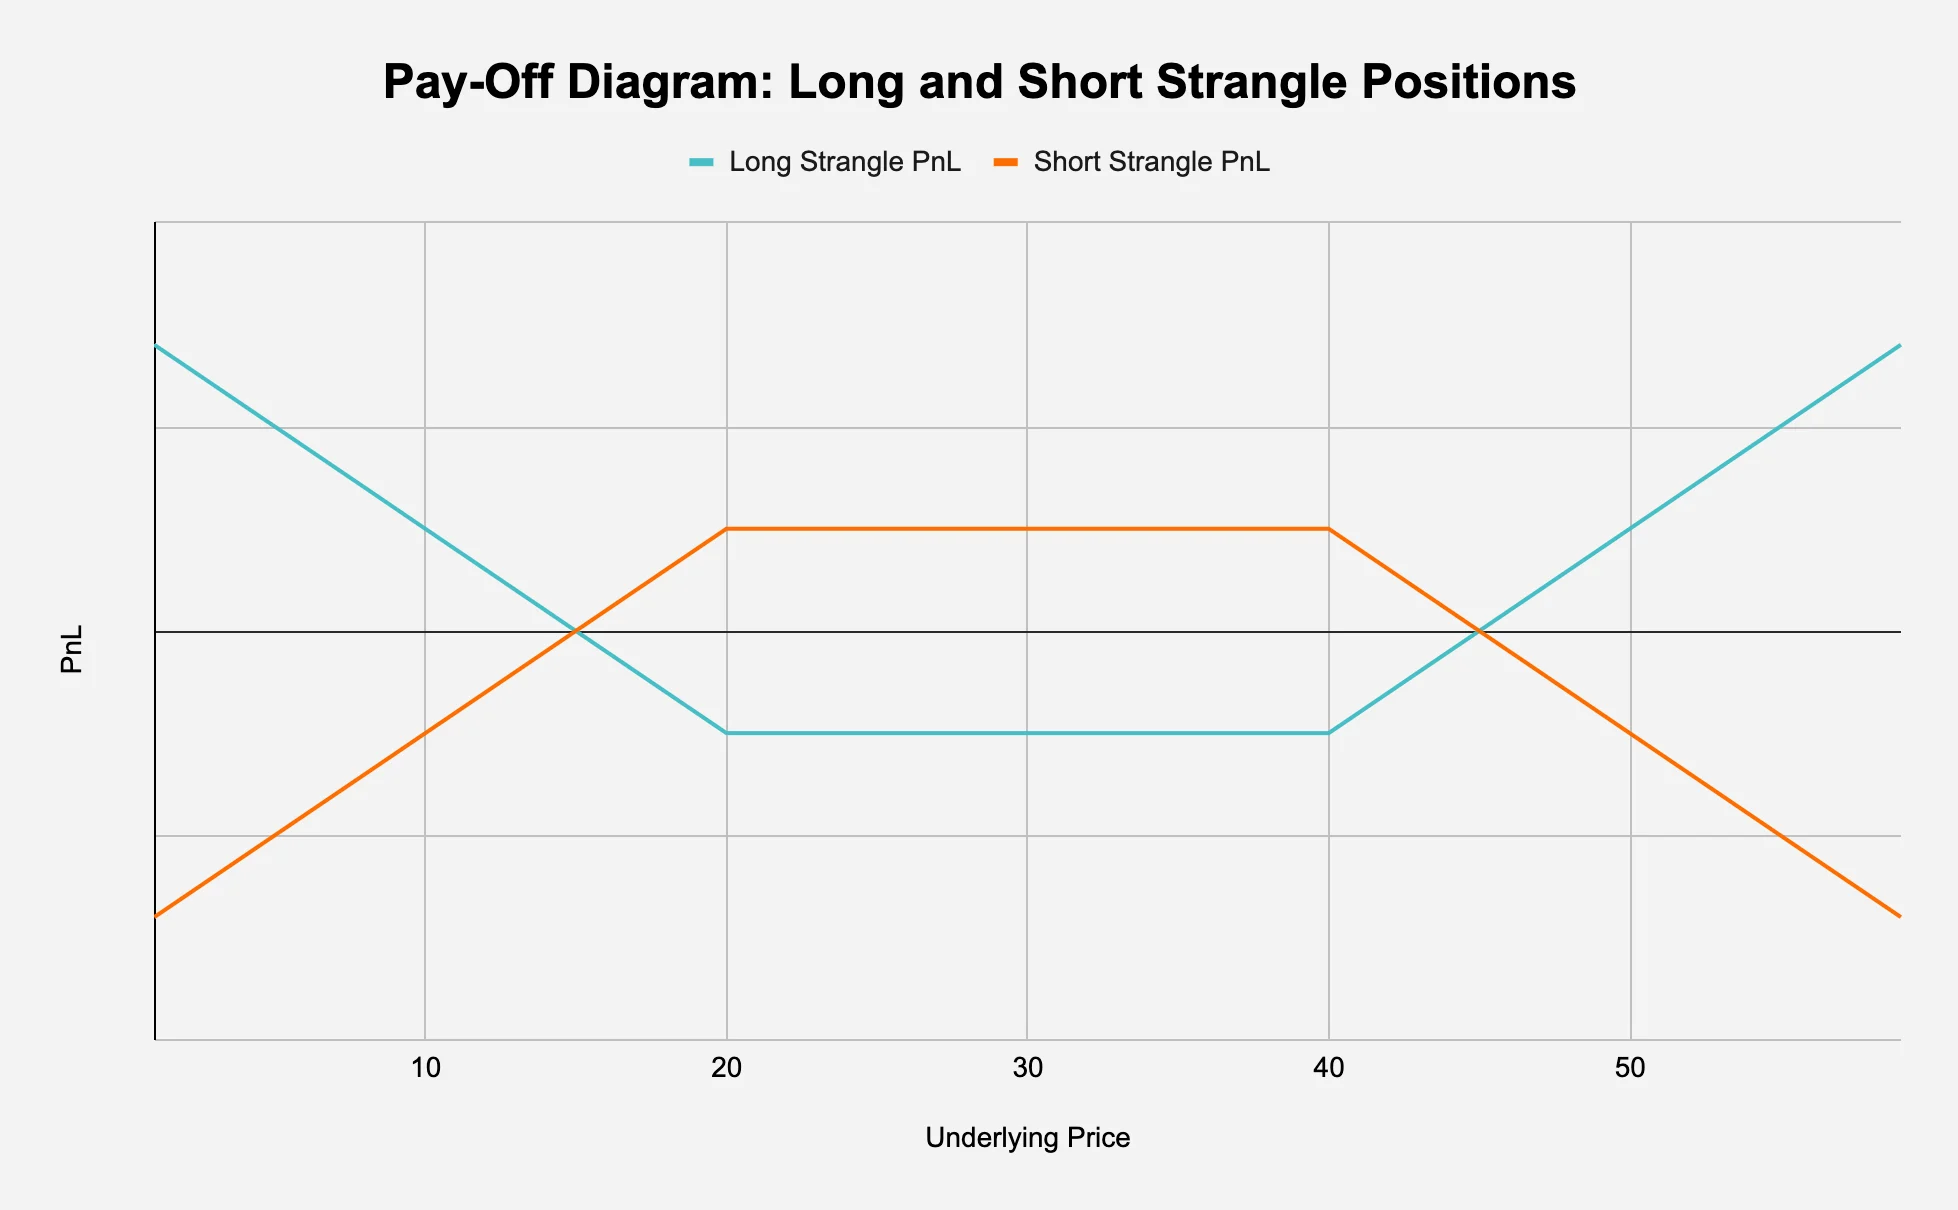
The result is a 4-legged position combined of the two strangles: short put at expiration_A, short call at expiration_A, long put at expiration_B, and long call at expiration_B. See Figure 6 for the pay-off diagrams for strangles, but it’s important to note that the diagram shows the pay-off for strangles with the same strikes and expiry date - for a calendar strikes have different expiry dates and potentially different strikes, so the PnLs do not cancel each other out as Figure 6 might suggest.
Figure 6: Short strangles have unlimited potential loss; Long strangles have unlimited potential profit
Source: Presto Research
A long calendar strangle benefits from a near-term volatility crush whilst still being positioning for the longer-term, so this is a suitable structure if you expect the election to be a non-event from a volatility perspective (which, as many traders know, is not that uncommon for highly anticipated events). This also has the benefit of theta (time decay) exploitation: by selling the near-term premium, we can capitalise on the accelerated theta decay whilst maintaining exposure to potential future moves.
How can we determine the expiry dates?
For the near-dated strangle, we select 08Nov24.
For the far-dated strangle, there are a few methods but given that buying a calendar strangle is essentially an IV term structure steepener, the processes will most likely involve identifying an underpriced expiry date further down the curve that can benefit from an IV increase, or if we are purely betting on the near-term IV falling, some point to anchor our term structure. An extension of this approach is the event-driven one, but since there are no significant Bitcoin native events or network upgrades in 2025, we look at the macro landscape.
In Figure 7a, when looking at the next four quarters starting at the current Q4 2024, we can see that Q1 2025 has the most number of cuts priced in (1.7 cuts). Perhaps this can be our starting point. The logic might be that the most cuts priced in means that the most potential variability in Fed policy that quarter, and therefore the highest chance for volatility caused by speculation around Fed policy path driven by changes in economic data.
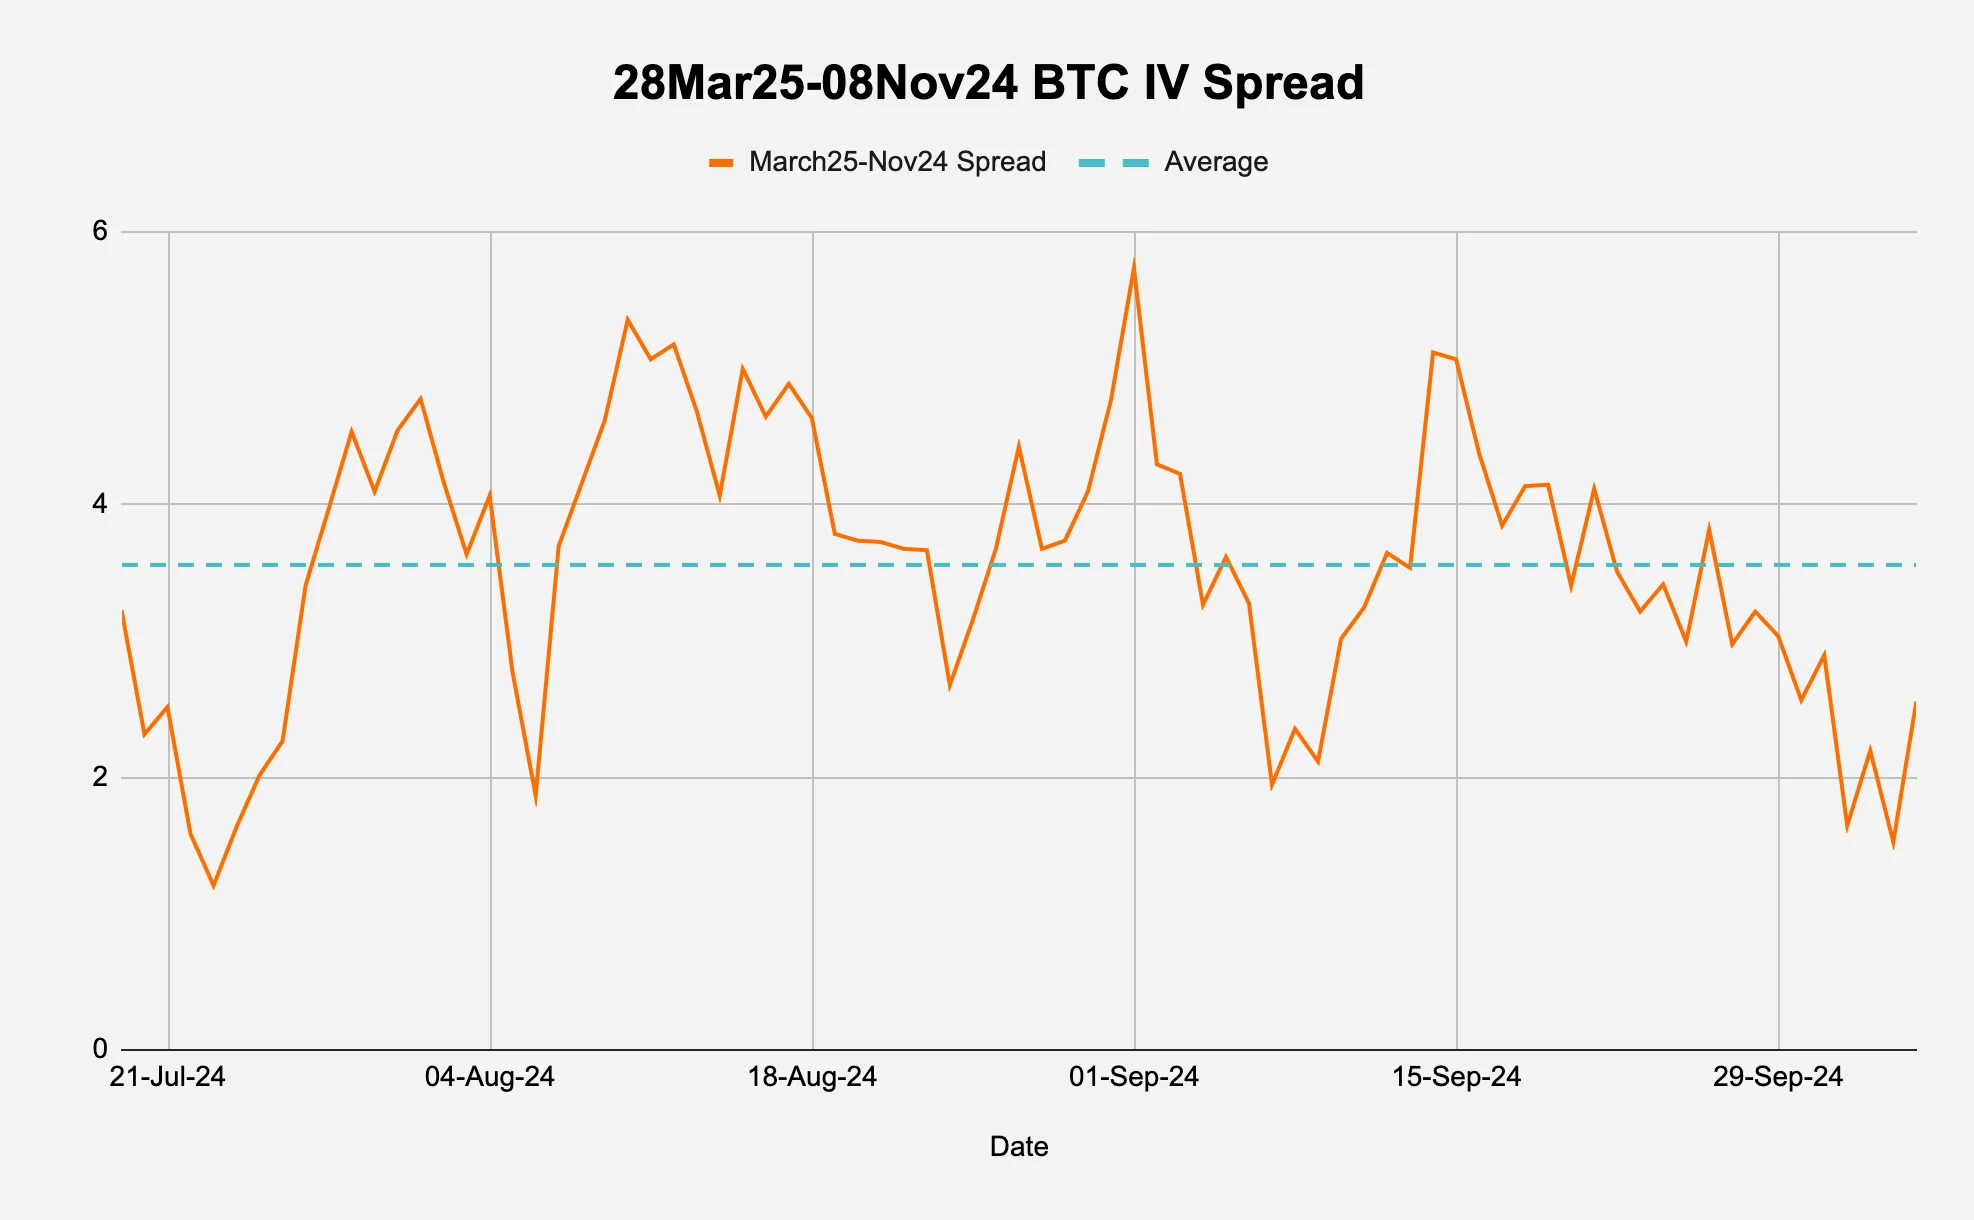
To examine this further, we take a look at the spread between the 28Mar25 expiry IV and the 08Nov24 IV in Figure 7b: an increase in this spread means a steepening of the IV term structure. We can observe a range bound time series with mean reverting tendencies. What is good for us, given that this is an IV term structure steepener, is that the spread is currently near the lows of that range (2.55 current versus 3.56 average).
Figure 7a: Q1 2025 has the highest number of cuts anticipate in the next four quarters

Source: CBOT, Presto Research; (data as of 05Oct24)
Figure 7b: The term structure seems mean reverting and at the lows
Source: Deribit via Laevitas, Presto Research; (data as of 05Oct24)
How can we determine the strikes?
There are many ways to choose the strikes but to keep the trend of simplification going, we roughly target 25 delta strikes for each leg.
Using Laevitas screens as of 05Oct24, we decide to sell the 55k/72k 08Nov24 strangle versus buying the 65k75k 28Mar25 strangle.
How many near-dated strangles do we buy? And how many far-dated strangles do we sell?
There are many ways to ratio the short and long strangles - delta neutral, gamma neutral, vega neutral, theta neutral, dollar (/notional) neutral, etc. - which will be determined based on the traders’ goal.
We want to our PnL to be exposed to the steepness of the IV term structure and be removed from the parallel changes so we decide to structure our calendar strangle to be vega neutral, which results in a 3x1 ratio i.e., we sell 3x 55k/72k 08Nov24 strangles and buy 1x 65k75k 28Mar25 strangle.
The trade visualised (the following visualisations are for 07Nov24, a day before the near-term strangle expires):
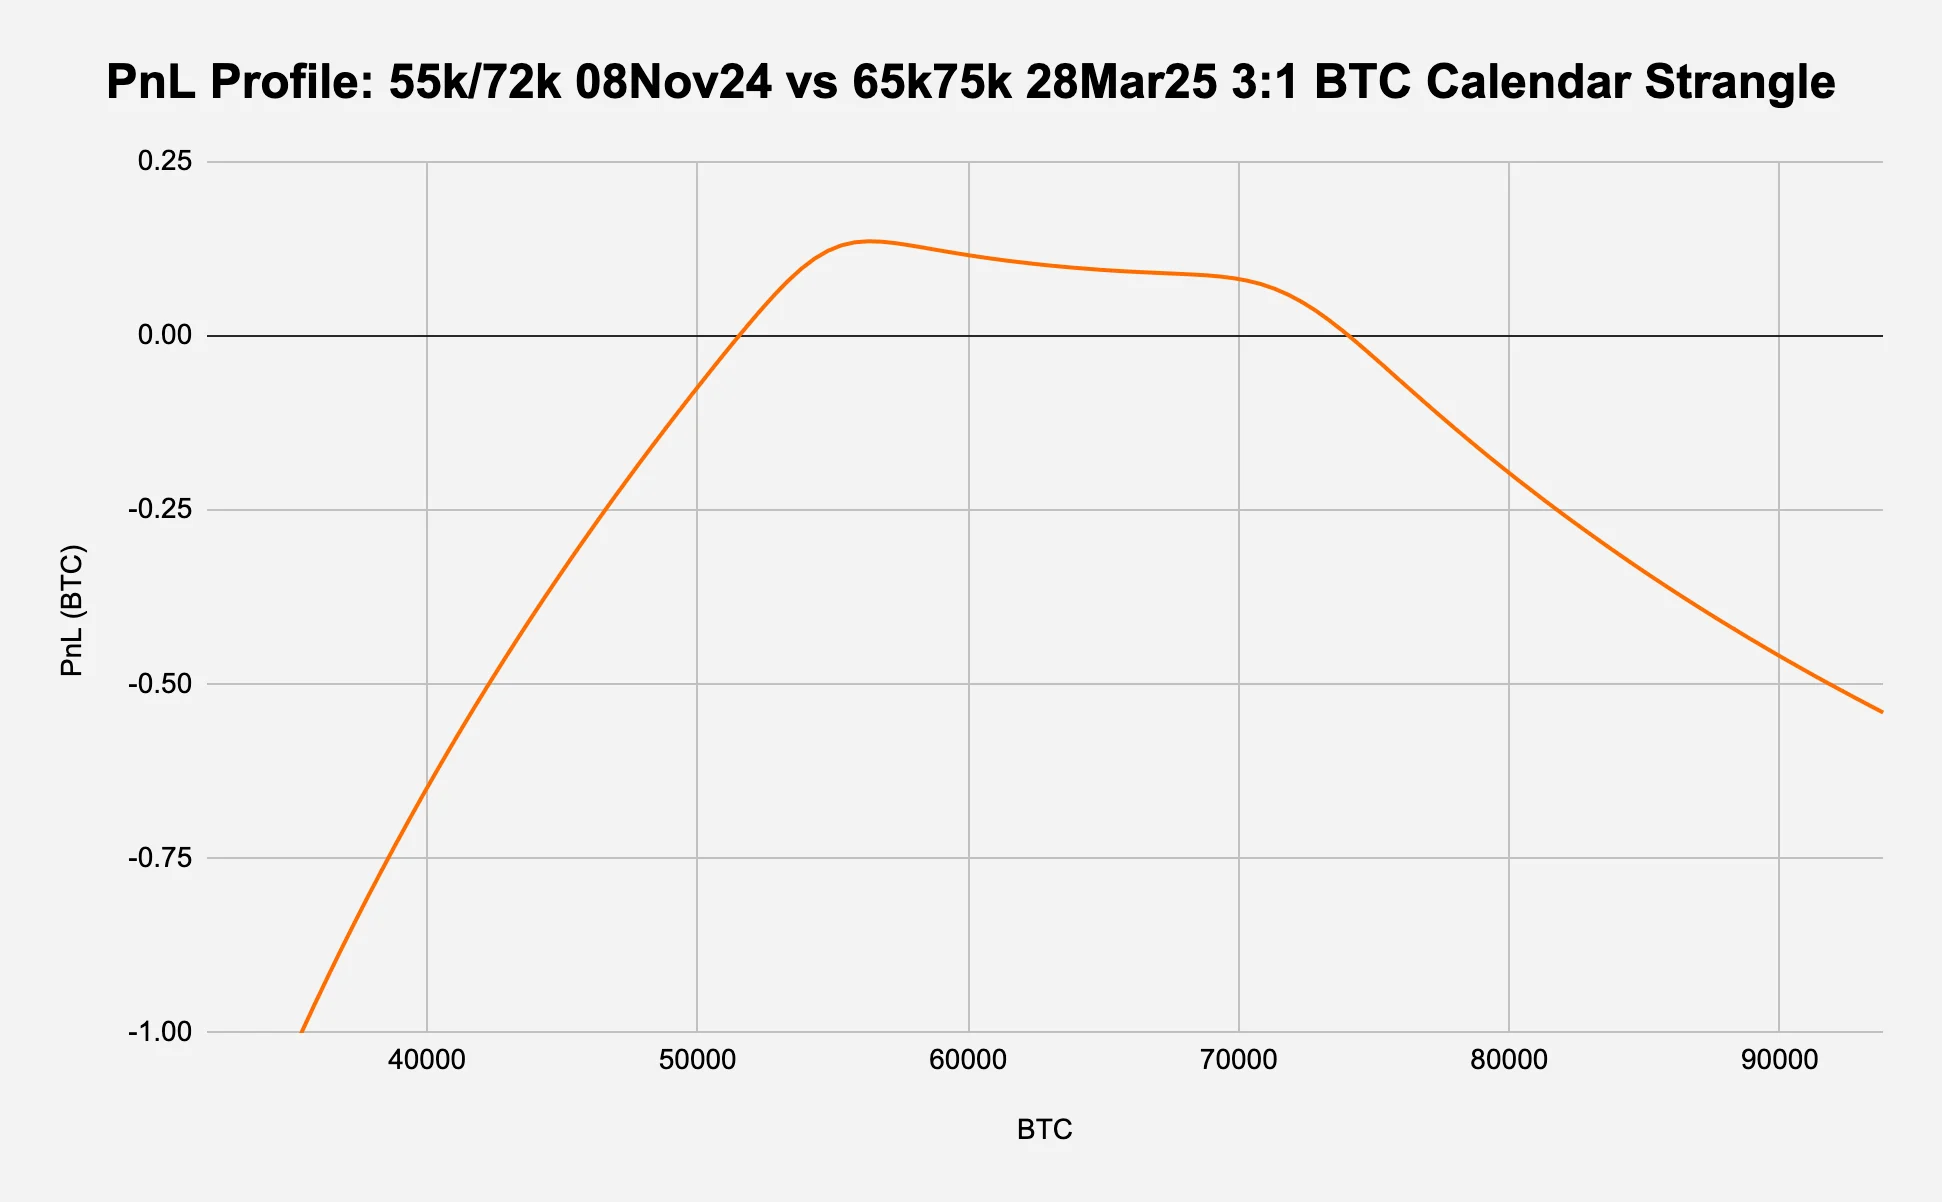
PnL profile (Figure 8a):
The PnL (and therefore the y-axis) is in BTC terms as Deribit options are coin-denominated.
The profile has a characteristic "mound" shape, with the highest potential profit occurring between the strikes of the near-term strangle (55k and 72k).
The profile becomes negative at the extremes, with steeper losses on the downside compared to the upside.
Figure 8a: The term structure seems mean reverting and at the lows
Source: Deribit, Presto Research; (data as of 05Oct24)
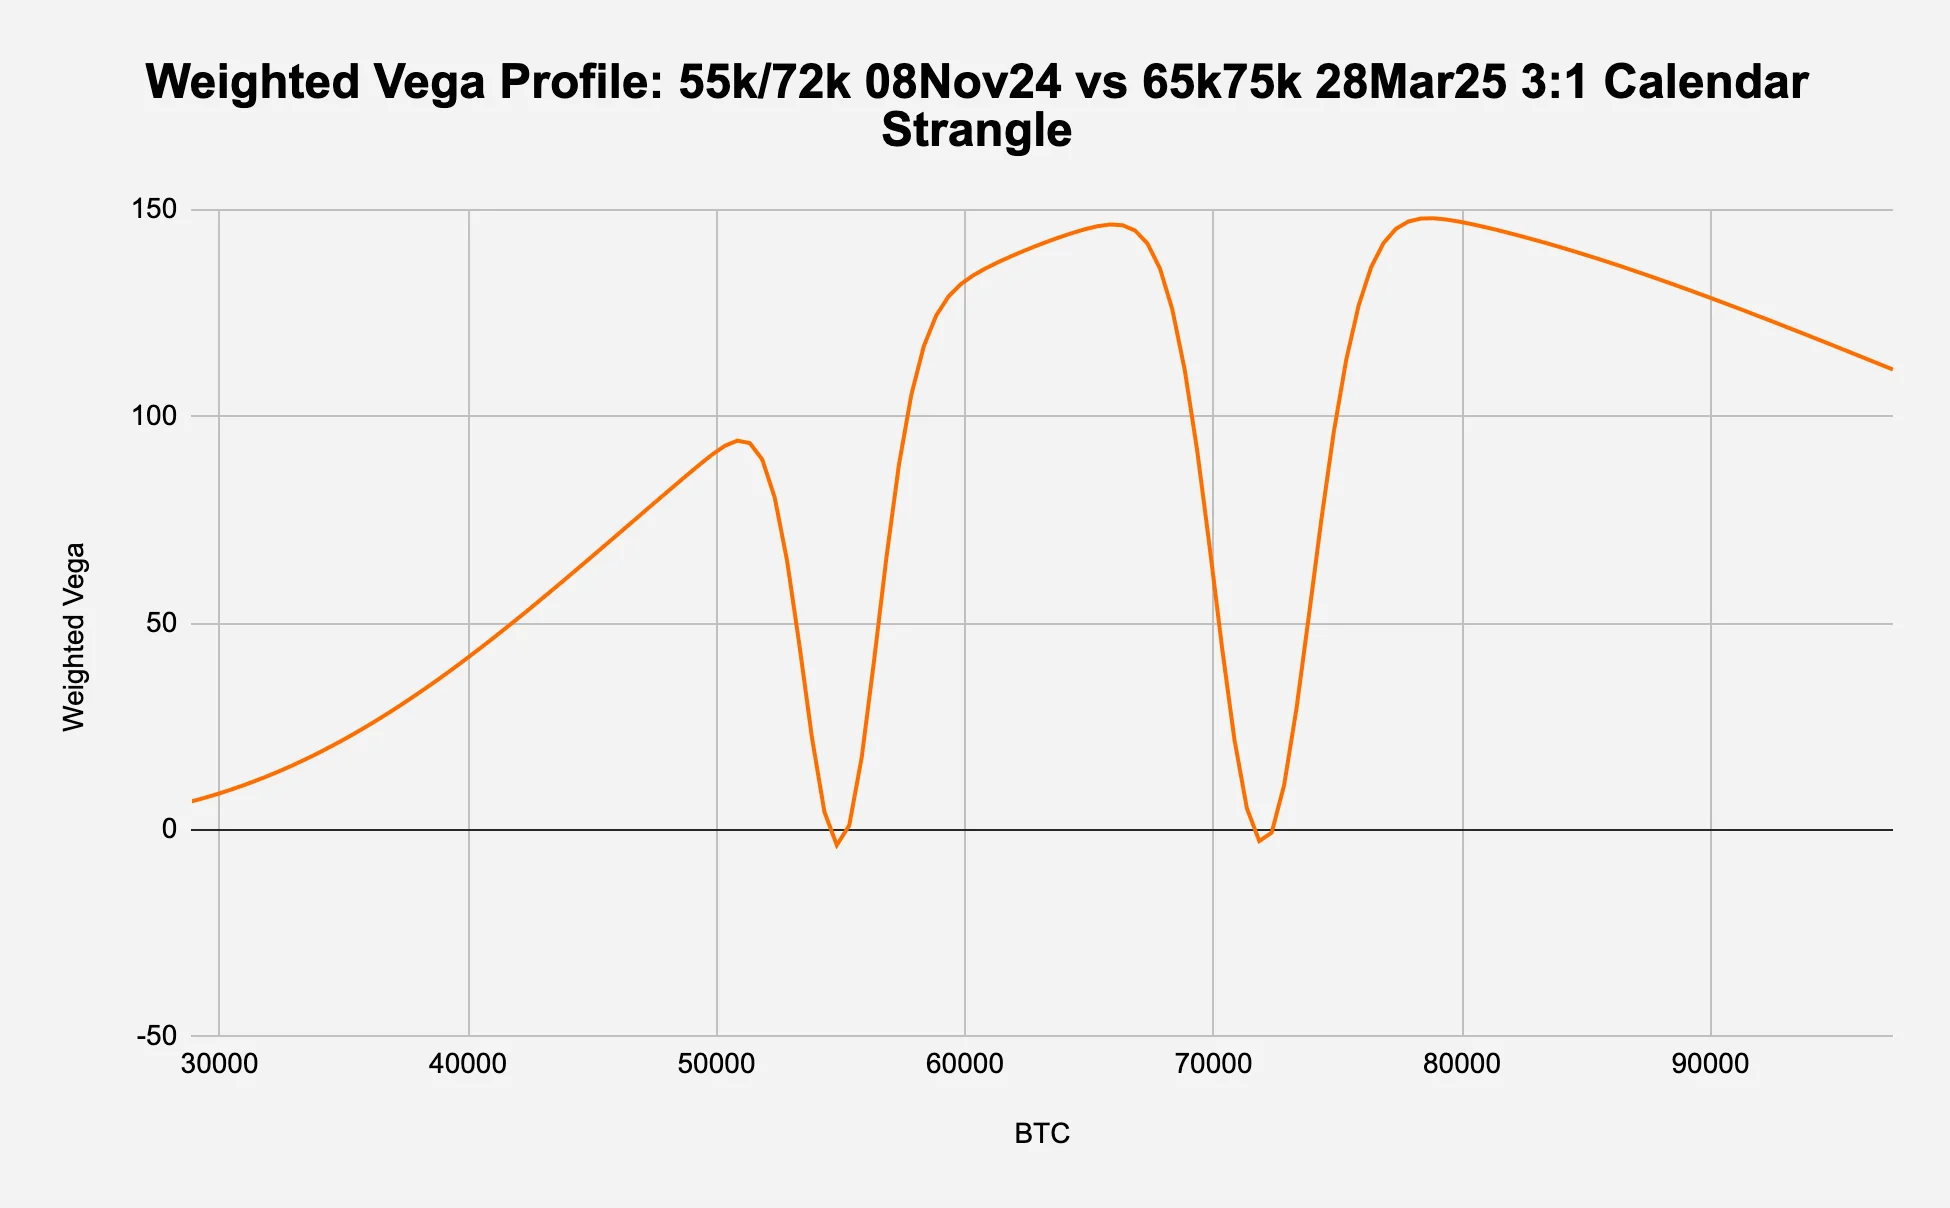
Weighted vega (Figure 8b):
A standard vega plot shows the absolute change in the option's price for a 1% change in IV for each strike - we plot the weighted vega to match our 3:1 ratio.
The vega is initially negative around spot (not shown), which is expected as this is an extremely short vega position i.e., we want a decrease in implied vol. However, since Figure 8b shows the vega profile for 07Nov24, we see an overall positive weighted vega with dips at the strikes of the near-term strangle.
The overall positive vega comes from the long position in the far-dated strangle - since vega measures sensitivity to changes in IV and longer-dated options are more sensitive to these changes, it is generally higher for options with more time until expiration.
The two dips to zero at the strikes of the short near-term strangle occur because:
As expiration approaches, the vega of at-the-money (ATM) options approaches zero very rapidly (the 3:1 ratio amplifies this effect).
Options that are exactly at their strike price (ATM) at expiration have no vega, as they become binary outcomes.
Figure 8b: Vega dips at the strikes of the near-term strangle
Source: Deribit, Presto Research; (data as of 05Oct24)
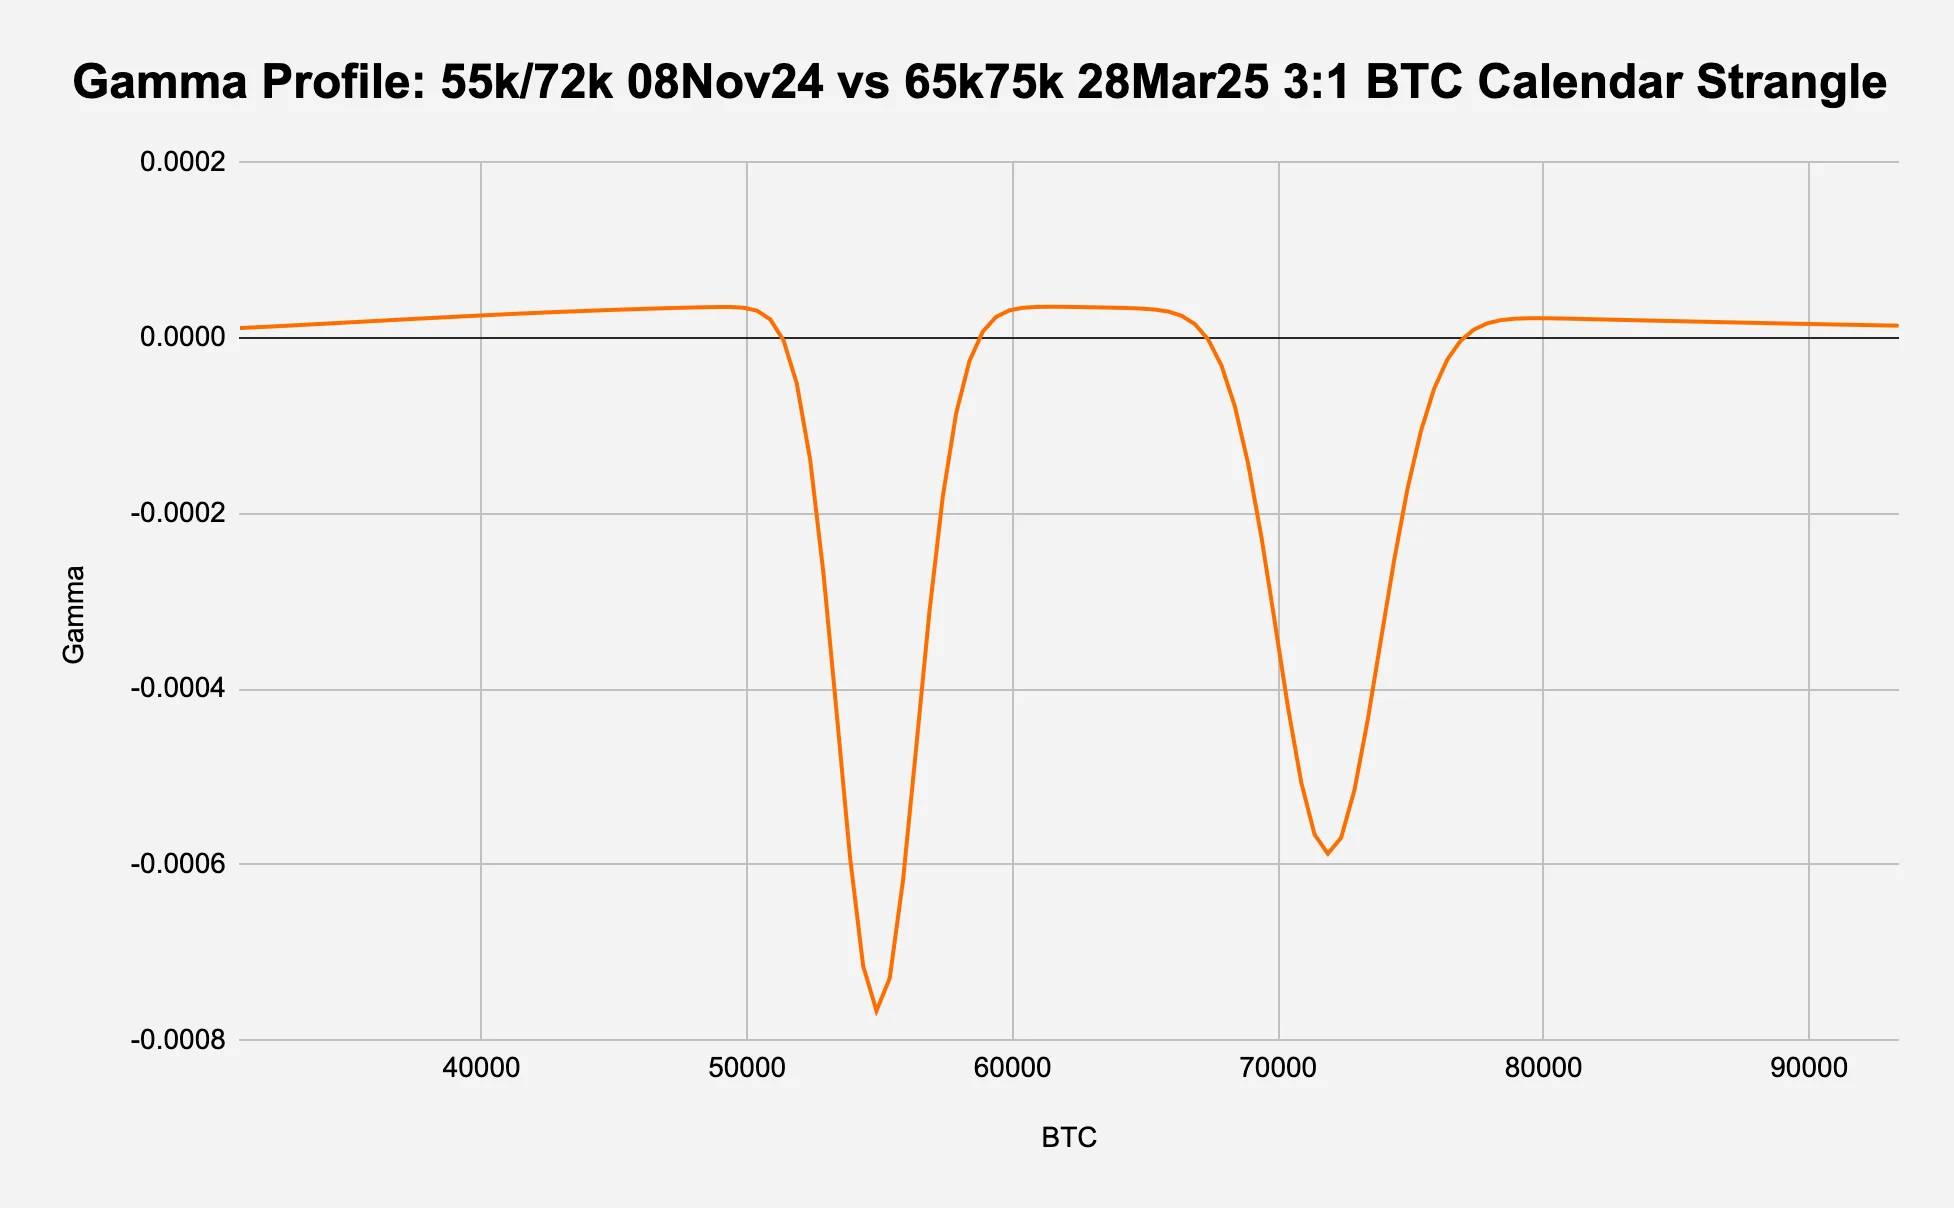
Gamma (Figure 8c):
A standard gamma plot shows the rate of change in delta with respect to changes in the underlying price for each strike.
The gamma profile shows significant downward spikes at the strikes of the near-term strangle (55k and 72k), which is expected as this is an extremely short gamma position at these strikes.
At trade onset, the plot is concave negative like an upside down hill (not shown) but by the first expiry, the positive gamma from the long far-term options outweighs the negative gamma from the short near-term options across most of the price range, except at the near-term strike prices where we see the sharp downward spikes.
Figure 8c: The term structure seems mean reverting and at the lows
Source: Deribit, Presto Research; (data as of 05Oct24)
What are the risks?
Main Risks:
Tail Risks: Significant losses as BTC sells off and theoretically unlimited losses as BTC rallies (see Figure 7a).
Pin Risk: This is the uncertainty and potential for unexpected losses that option sellers face when the price of the underlying asset closes very close to the option's strike price at expiration, making it unclear whether the option will be exercised - relevant for the short strangle at expiration.
Gamma Risk: Large price moves can cause significant losses due to negative gamma exposure.
Vega Risk: While initially vega neutral, changes in implied volatility term structure can impact profitability.
Liquidity Risk: BTC options market can become illiquid, especially for longer-dated contracts. This can also impact execution price.
Mitigation Strategies:
Active management of position, especially near expiration of short strangle.
Set stop-loss levels based on maximum acceptable loss.
Consider dynamic hedging to manage gamma exposure.
Monitor and adjust for changes in volatility term structure.
Use limit orders and avoid trading during low liquidity periods.
Size the position according to risk appetite.
Scenario Analysis:
Worst case: Large price move combined with volatility spike in near-term options.
Best case: Price remains range-bound, near-term volatility decreases while long-term increases.
4. The Final Word
The 2024 U.S. presidential election represents a significant event risk for bitcoin, as reflected in the 8% premium currently priced into its implied volatility. This premium suggests that the market expects BTC to potentially move an extra 8% per day, on top of its normal daily volatility, due to election-related uncertainty. This underscores the crypto market's increasingly heightened sensitivity to political outcomes and the unique opportunities it presents for volatility traders.
Our analysis reveals a complex interplay between the election premium, prediction market odds, and broader market dynamics. The recent divergence between the cheapening premium and rising odds of a Trump victory highlights the potential for mispricing and trading opportunities.
While our simplified approach provides a solid foundation for understanding and quantifying the election premium, it's crucial for traders to build upon this analysis with their own research and market views. The proposed trading strategies – going long OTM calls or implementing a vega-neutral calendar strangle – offer contrasting approaches to exploiting the election premium, catering to different market expectations and risk appetites.
As we approach the election, vigilant monitoring of the premium's evolution, alongside broader market conditions and political developments, will be essential. Traders should remain adaptable, ready to adjust their strategies as new information emerges and market dynamics shift.
Ultimately, the 2024 election premium in bitcoin options presents a fertile ground for sophisticated volatility trading. By combining rigorous analysis with creative strategy formulation, traders can position themselves to capitalise on this unique convergence of political events and cryptocurrency market dynamics.


